AWS Textract/Data Cleaning of the geographic names and locations in the ‘Atlas of the Chinese Empire’ (1908)
Backstory
I am in the middle of a bigger project, trying to map out the U.S. Army Air Forces in World War II. Combat Chronology 1941-1945. I already transformed the text in an excel file, separated by date: the data is not super clean, but is good enough. I transformed the data with a text-scraping session on python with full-on engagement of regex expressions.
This is nice and dandy, but where are my coordinates? Well, there is none! There are plenty of names of locations in the text, but a brute force extraction would require either a super tedious manual work, or a complex and lenghty work with Python Natural Language Toolkit.
I put away the project for a while because of life and work, but after some time I found out that the text that the Defense Website was sharing was a cut version without the appendix! I found the whole text on Hathi Trust, checked the quality, decided that I could do a better OCR job with Abbyy, and finally I obtained the whole appendix as a text file. With this appendix data I will be able to highlight in the general text of the Combat Chronology all the locations listed in the appendix. If I geocode the locations, then I will have something nice to work on.
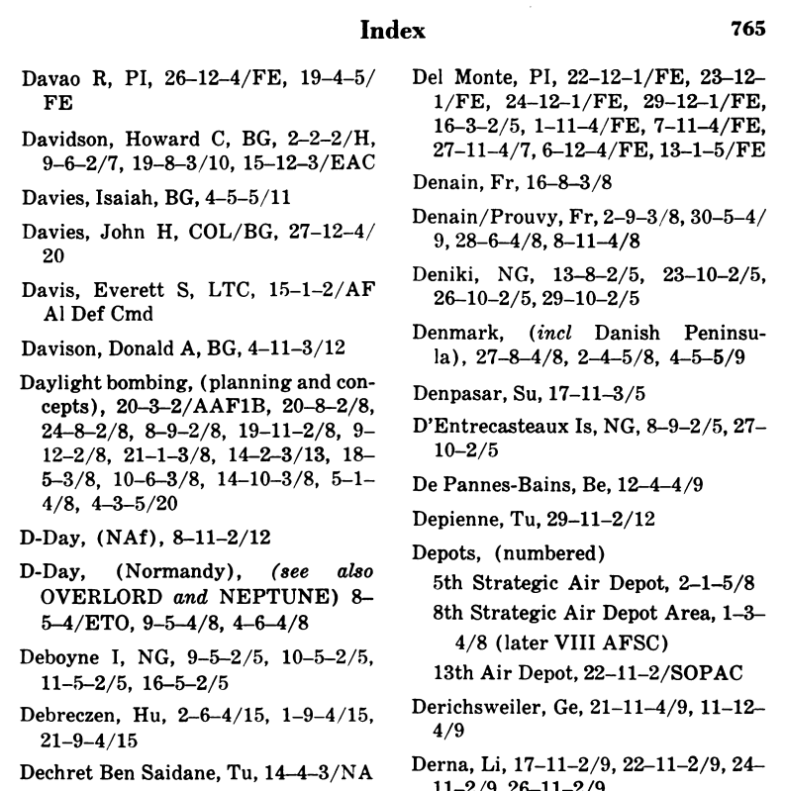
The appendix has an index with geographic locations (some with coordinates) together with important names, events, and military operations. Messy data again, but 300 pages of data. Text scriping again with Python: separate the entries, split them between the description part and the list part, use the abbreviations (luckily listed at the start of the Index) to understand if it is a location or other stuff. Clean up the problematic entries, substitute the abbreviations with the full geographic names, find the country code/s of today’s nations (borders change!), and voila’.
(Just Kidding)
[from here on, geocoding! (using Google Maps API, Nominatim (geopy), and a module I wrote to search in the downloadable database from the Geographic Names Server.]And here we are…
Why bother with the Chinese Empire names and coordinates in 1908? The problem is that the US. Airforce combat chronology of WWII uses old toponyms from the 1940s, and this creates a problem with anything that has some ‘pronounce attrition’ with English language. Much work has been done in the past 50 years, globalization and the web pushed for new conventions. Long story short, a big number of Chinese and Burmese names were not retrieved by any of the abovementioned geocoding tools (the Geographic Names Server seems more accurate, but unfortunately only with the UI online, because they don’t share the list of all names for the geographic feature in their downable 4+ Gb database(whyyyyy?!?!). (a great resource is also the Getty Thesaurus of Geographic Names Online – and downable databases)
A big help would be if I could find old lists of geographic features with their coordinates. Finally! Our Atlas of the Chinese Empire. Aside the fact that I am an Atlas nerd with a love for old maps, which makes this atlas a feast for my eyes, the most exciting thing is the boring index. In addition, all the data would allow me to have some fun making an interesting map.
I tried Abbyy, which was giving good results, but required a manual approach to the splitting of the tables. I tried deskewing, trapezoidal correction, and all the tools of the trade, but the table automatic recognition would still produce too many random errors that required manual correction. Too much work. The only solution was to manually split the cells, which would produce an excellent result, but also require hours and hours just for the text extraction. In the age of AI and in my busy life, this seemed excessive. BUT then, I remembered that Amazon Web Services’ Textract improved their table recognition and it seemed a perfect little side project to test it. Once you create an account, you can do few pages manually online or use python APIs. I wanted to test it, and I had only few pages to do, so I chose the manual approach.
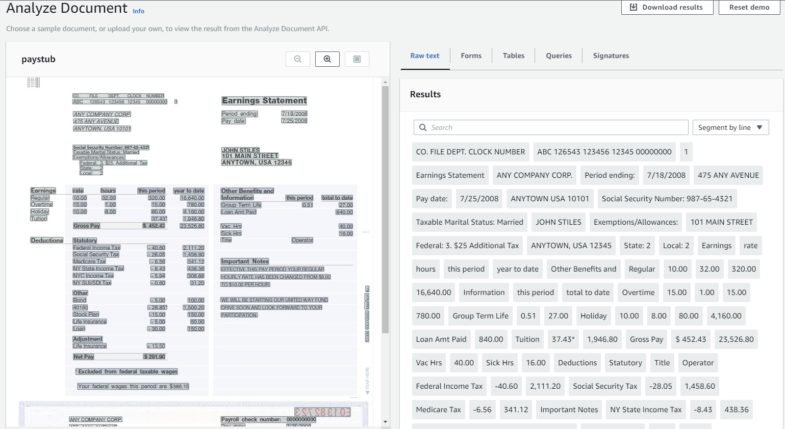
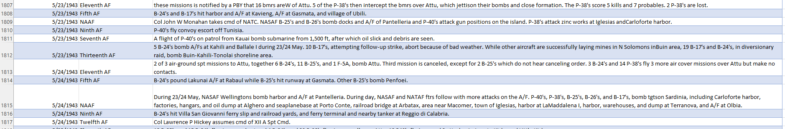
It is super easy: upload the page with a drag and drop on the left box, wait for the analysis, download the results with the button on the top-right. It gives a number of text files, all super interesting and with tons of details such as confidence on the correctness of the OCR. One file has all the tables of the page. The result is pretty impressive. There is some cleanup to do, but the rate of accuracy is pretty high:
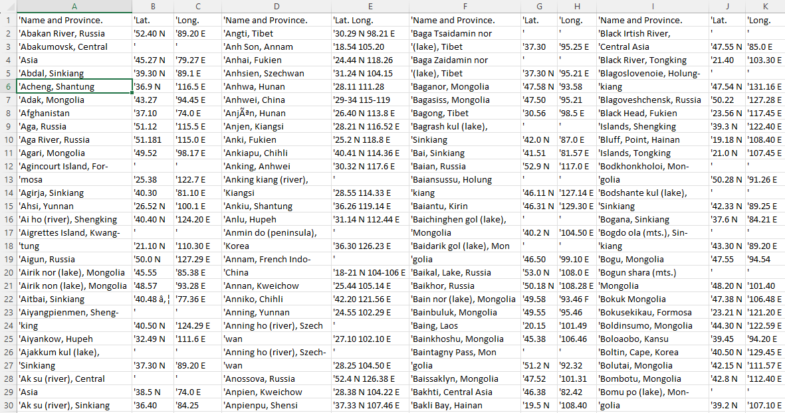
Then there is the fun part of python and pandas. Load all the tables as Dataframes; check when the coordinates were split into two separate columns and merge them; cleanup (all these terrible ‘ characters). Then we want a well-organized full list with ‘Name_and_Province’ and ‘Lat-Long’ columns only. I reorganized the tables splitting them by couples of columns and then concatenating them all together.
Below is the code for the reorganization
import pandas as pd
import os

savefile = "Full_output.xlsx"


def reorganize(df: pd.DataFrame) -> pd.DataFrame:
    """takes a dataframe, split it by Name and Province and coords couples of
        columns, and then reorganize everythin as a concatenation"""
    df1 = df[["Name_and_Province_1", "Coords_1"]]
    df2 = df[["Name_and_Province_2", "Coords_2"]]
    df3 = df[["Name_and_Province_3", "Coords_3"]]
    df4 = df[["Name_and_Province_4", "Coords_4"]]
    all_df = [df1, df2, df3, df4]
    new_df = []
    for dfr in all_df:
        new_df.append(
            dfr.rename(
                columns={dfr.columns[0]: "Name_and_Province", dfr.columns[1]: "Lat_Lon"}
            )
        )
    return pd.concat(new_df, axis=0)


def main():
    path = "Tables"
    files = [x for x in os.listdir(path) if os.path.isfile(os.path.join(path, x))]
    tail = "abcdefghilmnopq"
    all_df = []
    for file in files:
        with open(f"Tables\{file}", "r", encoding="utf8") as f:
            df = pd.read_csv(f)
            tail_idx = 0
            for column in df.columns:
                if "lat" in column.lower() and not "lon" in column.lower():
                    lat = df.columns.get_loc(column)
                    lon = lat + 1
                    lon_name = df.columns[lon]
                    df[column] = df[column] + df[lon_name]
                    new_name = f"Coords_{tail[tail_idx]}"
                    tail_idx += 1
                    df = df.rename(columns={column: new_name})
                    df = df.drop(columns=lon_name)
            df = df.rename(
                columns={
                    df.columns[0]: "Name_and_Province_1",
                    df.columns[1]: "Coords_1",
                    df.columns[2]: "Name_and_Province_2",
                    df.columns[3]: "Coords_2",
                    df.columns[4]: "Name_and_Province_3",
                    df.columns[5]: "Coords_3",
                    df.columns[6]: "Name_and_Province_4",
                    df.columns[7]: "Coords_4",
                    df.columns[8]: "No_Name",
                }
            )
            all_df.append(df)
        reorganized = []
        for dft in all_df:
            reorganized.append(reorganize(dft))
        full_df = pd.concat(reorganized, axis=0)
        full_df.to_excel(savefile, index=False)


if __name__ == "__main__":
    main()
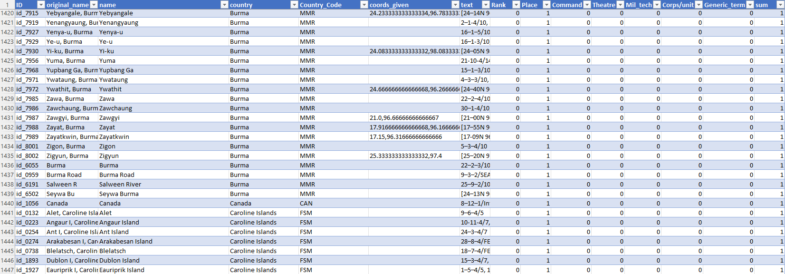
Once everything is well organized, some code to check the rows that should be together (multi-line descriptions for long names on the pages). To minimize as possible the last, tedious manual work of checking the data (still possible because it is not ‘just’ 6810 rows of data) a nice trick is to write a script that adds another column highlighting when a row is not in alphabetical order with the contiguous ones.
I also split the coordinates using a regex search in two new columns, so I will be ready for mapping later on.
import pandas as pd
import regex as re

input = "Modified.xlsx"


def clean_nan(item: list | str) -> list | str:
    if isinstance(item, list):
        ret_list = []
        for i in item:
            if not pd.notna(i):
                ret_list.append("")
            else:
                ret_list.append(i)
        return ret_list
    else:
        if pd.notna(item):
            return item
        return ""


def check_order(triad: list[str]):
    filtered = [x for x in triad if x != ""]
    a_sorted = sorted(filtered)
    if filtered == a_sorted:
        return True
    else:
        return False


def split_coords(str) -> tuple:
    if pd.notna(str):
        pattern = re.compile(
            r"(?P<lat>\d?\d\d[.-](\d{1,2})?).+(?P<lon>\d?\d\d[.-](\d{1,2})?)"
        )
        coords = re.search(pattern, str)
        if coords:
            return (coords.group("lat"), coords.group("lon"))
    return ("", "")


def main():
    df = pd.read_excel(input).to_dict("records")
    modified = []
    for index, item in enumerate(df):
        if index - 1 >= 0:
            str_1 = df[index - 1]["Name_and_Province"]
        else:
            str_1 = ""
        str_2 = df[index]["Name_and_Province"]
        if index + 1 <= len(df) - 1:
            str_3 = df[index + 1]["Name_and_Province"]
        else:
            str_3 = ""
        triad = clean_nan([str_1, str_2, str_3])
        if not check_order(triad):
            item["not_alpha"] = 1
        item["Lat"], item["Lon"] = split_coords(clean_nan(item["Lat_Lon"]))
        modified.append(item)
    printer = pd.DataFrame(modified)
    printer.to_excel("Modified_2.xlsx")


if __name__ == "__main__":
    main()
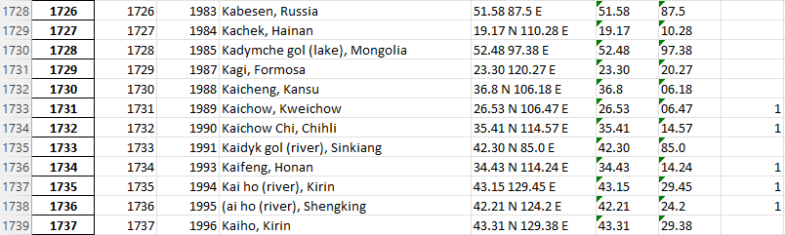
The result is pretty good, only 880 rows are highlighted as not in alphabetical order and only a fraction of them are actual errors. The old Atlas rightfully followed the ordering convention to put the ‘simplest’ feature on top, as you can see below for Kaichow and Kaichow Chi, but this convention breaks a simple alphabetical check. I could have split the name by commas and check only the first part, but it is an easy enough check that I preferred to maintain it and be a little more thorough. However, as in the image below, real mistakes such as ‘(‘ for ‘K’ here are easily found and corrected.