Mapping WWI Naval Warfare
Maps are an incredible tool for understanding events. Oddly enough, historians are interested and fascinated by maps, but not really fond of using or making them. As a military historian, too many times I have had to read chapters full of regimental numbers, town names and detailed description of movements of troops with the help of a single rudimentary map, if any. Historians write books, are judged by colleagues on their writing, and teach with books. This is not changing anytime soon, and probably it should not. There is, however, an over-reliance on text, and an image could easily substitute pages of descriptions, making history more lean and easy-to-understand, qualities academia often forgets.
The problem is it is easy for a historian to write a few pages yet complicated to make a map. We are writers by trade and even if we manage to study Illustrator, Photoshop, or GIS, we often lack the skills to create a well-designed illustration. In addition, the collection of data and the use of it is time-expensive and often the academic world does not recognize the amount of work behind a single image (it is only one page!).
This post is precisely about that: data collection and project management in making maps.
Incredibly enough, there is not a map of the First World War’s shipwrecks. At least not on the internet; not as an interactive map or video. Not that I can find. There is an interesting article on the Smithsonian website, with a map of the ships sunk by U-Boat attacks, however there is no sign of the ships lost because of sea mines or other reasons.
Where is the data?
To map the ships we need a list of them. The list should contain the name of the ship, the date of sinking, the location, the reason of the sinking, and perhaps a description. The more data, the better, but the bare minimum should include the name and the position. With these two attributes it is possible to make a map, where a dot is in a certain position and has a certain name. Being minimalistic, a list of coordinates is enough to populate the map. However, if we want to do something more than a static image with dots, more information is needed.
Searching online, I didn’t find a free-to-access database of all the shipwrecks from WWI. We want online data machine readable data, or at least digitized documents we could potentially OCR, because we are talking about thousands of ships, and personally I don’t really enjoy the zen art of the manual transcription of data (that actually could take weeks).
One website has all the information necessary: a well-designed website and a detailed database of shipwrecks all around the world. However, after taking a week to program a web-scraping script that could manage the problem (the website is in ASP and the pages are full of JavaScript and really hostile to scraping), my IP was temporary banned because I was utilizing too much bandwidth for their website. I was doing nothing illegal, Google does it all the time, but I did not want to disturb the team that had clearly invested time and money in their database for shipwreck divers, so I diverted my attention to other places.
And here we find Wikipedia, with all the ships listed by date, organized in pages. These pages did not appear in my searches for shipwrecks, databases and similar researches, but they came out when I was searching for individual names of ships. Perfect! But it is Wikipedia, so there is not any assurance that the list is complete and accurate. Continuing the research however, I found a publication listing all the shipwrecks between 1824 and 1962[1] and a random check over the list online provide the necessary counter proof.
There were however a couple of problems:
- Not all the ships listed on Wikipedia have the coordinates of the sinking location
- The list is divided in pages by month, with tables that subdivide them into days.
The second problem is the easiest to solve: a simple Python Script can collect and organize the data for us.
The first problem is much more complex, because in the majority of the descriptions of the ships we can find the location in a format like “the ship hit a mine and sunk x nautical miles (y Km) south by south east from this location.” There is the data, but it is not the longitude and latitude numbers that we need to make the map.
You can find the solution for the easy problem (in Python) here.
The second problem required a more complex approach using C#.
[1] Charles Hocking, Dictionary of Disasters at Sea During the Age of Steam: Including Sailing Ships and Ships of War Lost in Action, 1824-1962 (London: Lloyd, 1969).
Writing a C# program to semi-automate the retrieval of the coordinates.
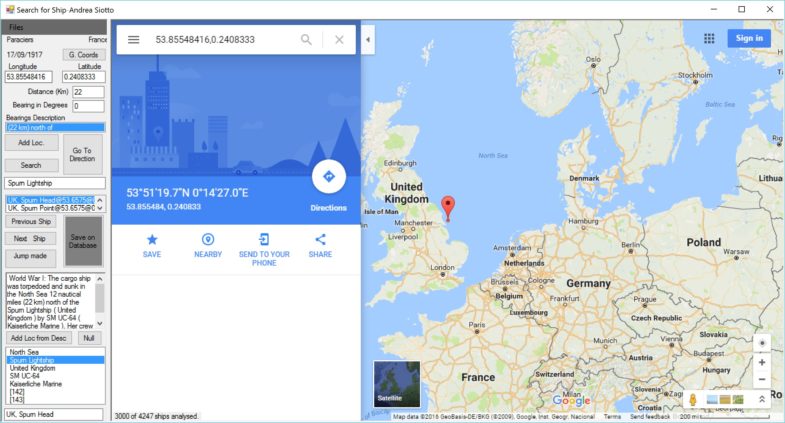
Once the data was collected and organized in a csv file with the name of the ship, the date of sinking, the country of the ship, the coordinates, the description, and a list of the links offered by Wikipedia, there was a big problem to solve: half of the ships did not have coordinates.
For the majority of these almost four thousand ships without coordinates the location of sinking was present in the description in a format such as “(125 km) north east of random-lighthouse.” There was still hope, but either I would have to spend months on doing the job manually or I could implement software that automated the task as much as possible.
A decent plan was necessary: I wanted the software to find the location of the “random lighthouse or place”, then to find the bearing, to translate it into degrees, to retrieve the distance in the text, and to find on the map the approximate coordinates of the sinking location.
Let’s see the different tasks one by one.
To find the location seems an easy task: we could query Google Maps. However, often it is difficult to find locations that are important for sailing such as lighthouses and moreover light vessels, especially if their name was changed after one hundred years. To solve this problem, I decided to find a database of such locations with their coordinates. It was not a simple task, but once I found the relevant webpages I could use a mix of Python scripting, Excel, and Notepad++ to create another csv file with such locations. My program in C# first interrogates the list of locations, if it does not find them then it asks Google Maps and if successful then I can manually add the location to the list with a button. In the rare case that it does not find the location I can search online, then go on the map in the program, and add the location. Adding the location to the list is fundamental, because the more I add, the less I need to search with long navigations in the browser.
To find the bearing and distance I had to analyze the description. At the end of this article you can find the code of the two functions that find the bearings and convert them into degrees. There is one key element that I strongly suggest you to learn well: regular expressions. They will solve so many troubles for you that you will start to love them (after the first frustrations). A great help in learning them is this website, where you can test your expressions and learn them in the best way: trying them.
Once I had the coordinates of our reference place (for example the lighthouse), bearing, and distance, I could calculate the approximate location where the ship sank. I tried to use complicated functions that considered the shape of the earth, but after some frustrating problems, I decided that I could find a practical solution with some easy math and considering the earth as a sphere. The locations are imprecise anyway, and an error of even ten kilometers was not a problem for our task.
The program then saves the ship on another file with the added coordinates.
A few considerations:
Why C#? – Because it is the easiest way (that I know) for making a program in windows with all the fancy stuff like buttons, textboxes, and menus. All this stuff is fundamental to implement a program that helps in managing data.
How did you put Google Maps in your program? – There is a browser integration into the program. It was necessary to have a visualization of the position of the ship and check that there was not an obvious problem (such as the ship sunk in the middle of Ireland). To incorporate the browser in your program I used CefSharp, a library that I would recommend strongly.
Are you an expert in User Interfaces? – I am an historian, so not at all. And I am obviously not an expert programmer. But I kept my mind open, I modified things doing test runs, and I looked for the least number of clicks and copy-and-paste possible; slowly I noticed that I was using mostly 3 buttons and I decided to group them and increase their dimension. I basically evolved the program for my personal needs and preferences.
