Mapping the Forgotten: A Technical Reflection on WWI Shipwreck Data - 2016
Dataset: https://github.com/SiottoTamat/WWI-Wrecks
Maps are an incredible tool for understanding events. Oddly enough, historians are interested and fascinated by maps, but not really fond of using or making them. As a military historian, too many times I have had to read chapters full of regimental numbers, town names, and detailed descriptions of troop movements with the help of a single rudimentary map—if any at all. Historians write books, are judged by colleagues on their writing, and teach with books. This is not changing anytime soon, and probably...
The problem is it is easy for a historian to write a few pages yet complicated to make a map. We are writers by trade, and even if we manage to study Illustrator, Photoshop, or GIS, we often lack the skills to create a well-designed illustration. In addition, the collection of data and the use of it is time-expensive, and the academic world often does not recognize the amount of work behind a single image ("it's only one page!").
This post is precisely about that: data collection and project management in making maps.
Incredibly enough, there is not a map of the First World War’s shipwrecks. At least not on the internet—not as an interactive map or video. Not that I can find. There is an interesting article on the Smithsonian website with a map of the ships sunk by U-Boat attacks; however, there is no sign of the ships lost because of sea mines or other reasons.
Where is the data?
To map the ships, we need a list. The list should contain the name of the ship, the date of sinking, the location, the reason for the sinking, and perhaps a description. The more data the better, but the bare minimum should include the name and the position. With these two attributes, it is possible to make a map where a dot is in a certain position and has a certain name. Being minimalistic, a list of coordinates is enough to populate the map. However, if we want to do more than a static image with dots...
Searching online, I didn’t find a free-to-access database of all the shipwrecks from WWI. We want machine-readable online data—or at least digitized documents we could OCR—because we are talking about thousands of ships. Manual transcription could take weeks.
One website has all the necessary information: a well-designed site and a detailed database of shipwrecks. However, after developing a scraping script over a week (facing ASP + JavaScript-heavy pages), my IP was temporarily banned for high bandwidth use. Although nothing illegal occurred, I didn’t want to disturb a clearly valuable resource made for divers, so I moved on.
Then I found Wikipedia: lists of ships by date, organized in monthly pages. These didn’t show up in general searches but appeared when looking for specific ship names. Perfect! But it’s Wikipedia, so there's no guarantee the list is complete or accurate. Later I found a publication listing all shipwrecks between 1824 and 1962[^1], which validated the online data.
However, there were two problems:
- Not all Wikipedia-listed ships have coordinates.
- The list is divided across pages by month, each with daily tables.
The second issue is easy: a simple Python script can collect and organize the data.
The first issue is harder. Many descriptions include text like:
“The ship hit a mine and sunk x nautical miles (y km) south by southeast from this location.”
The data is there—but not in lat/lon format.
The complex part required a C# application.
Writing a C# Program to Semi-Automate Coordinate Retrieval
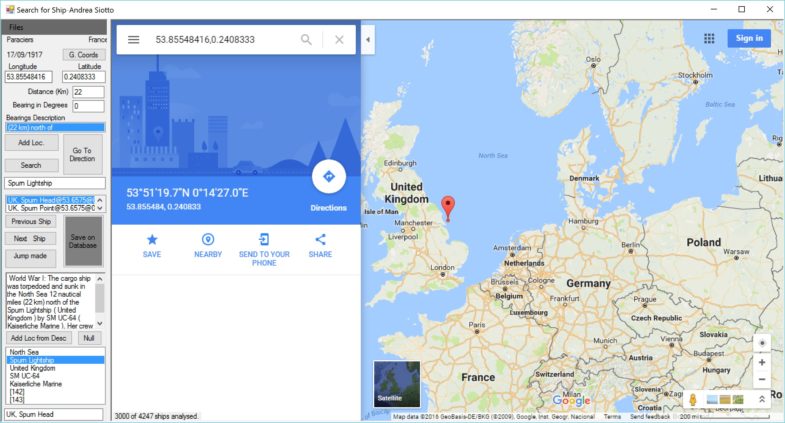
Once the data was collected into a CSV file with the ship name, date, country, coordinates, description, and Wikipedia links, I faced a major problem: about half of the entries lacked coordinates.
In most of these cases, the location was in the description in relative format, such as (125 km) northeast of random-lighthouse. There was hope: either spend months doing this manually or write software to automate as much as possible.
The plan: - Find the reference place (e.g., lighthouse) - Identify the bearing and translate it to degrees - Extract the distance - Use those to estimate the approximate coordinates
Step-by-step:
1. Find the reference place
Initially, I considered using Google Maps directly, but it struggled with historical locations, especially renamed or obsolete lightships. Instead, I built a secondary CSV file of known navigation-related places (lighthouses, vessels, etc.) using a mix of Python, Excel, and Notepad++.
The C# program first queries this local list. If not found, it falls back to Google Maps. If successful, I can manually confirm and add the new place to the list with a button in the app. This improves the process over time.
2. Extract bearing and distance
This required analyzing natural language. At the end of this article, you’ll find two C# functions for parsing and converting compass bearings into degrees.
Pro tip: Learn regular expressions. They can save countless hours and help extract complex data from natural language. Try regex101.com to learn and test.
3. Calculate approximate coordinates
Once you have the reference location, bearing, and distance, you can compute the target coordinates. After some experimentation with geodesic formulas, I opted for a simpler spherical math solution. Given the general imprecision of the data, an error margin of a few kilometers was acceptable.
The program then saved each ship’s record—with estimated coordinates—to a new CSV file.
[^1]: Charles Hocking, Dictionary of Disasters at Sea During the Age of Steam: Including Sailing Ships and Ships of War Lost in Action, 1824–1962 (London: Lloyd, 1969).